Three areas in Banbury record significantly high Covid rates
and live on Freeview channel 276
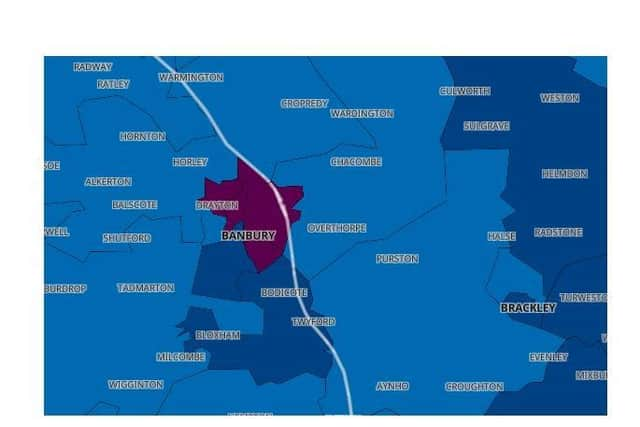
Three areas in Banbury have shown significant increases in Covid rates.
According to the latest figures over the seven days to December 16, the Cherwell district has seen a 128.4% rise, with 386 people testing positive for Covid-19..
Advertisement
Hide AdAdvertisement
Hide AdThat brings it to a rolling rate of 256.5 per 100,000 people, which is above the national average.

Cherwell is now 102nd out of 315 local authorities in terms of positive cases.
The wards inside the district with the highest rates are all in and around Banbury - Banbury Grimsbury, Banbury Neithrop and Banbury Hardwick.
Neithrop has a very high rolling rate of 578.1 per 100,000 people.
Advertisement
Hide AdAdvertisement
Hide AdHere are the figures from the seven days to December 16 for those three areas
Seven–day rates are expressed per 100,000 population and are calculated by dividing the seven day count by the area population and multiplying by 100,000.
Banbury Neithrop
Seven days to 16 December 2020
Total cases 34
The rate has increased relative to the previous week.20 (142.9%)
Rolling rate 578.1
Banbury Hardwick
Seven days to 16 December 2020
Total cases 41
The rate has increased relative to the previous week.28 (215.4%)
Rolling rate 497.5
Banbury Grimsbury
Total cases: 58
Advertisement
Hide AdAdvertisement
Hide AdThe rate has increased relative to the previous week by 23 (65.7%)
Rolling rate: 488.9 (which is well above the national average)
Here are the figures from the seven days to December 16 for the Cherwell district
Seven–day rates are expressed per 100,000 population and are calculated by dividing the seven day count by the area population and multiplying by 100,000.
Cherwell
Seven days to 16 December 2020
Total cases: 386
Advertisement
Hide AdAdvertisement
Hide AdThe rate has increased relative to the previous week of 217 (128.4%)
Rolling rate: 256.5 (which is above the national average)
South Northamptonshire (neighbouring authority)
Total cases: 223
The rate has increased relative to the previous week by 102 (84.3%)
Rolling rate: 236.0 (which is above the national average)